Please enter the four frequencies (in Hz) of the peaks in descending order and the frequency SF of the
reference compound (in MHz), as well as the desired total width of the simulated spectra in pixels
(be reasonable ;-):
Input Data
AB spectrum:
ν1 / Hz
ν2 / Hz
ν3 / Hz
ν4 / Hz
2468.2
-4568.3
-14406.3
-21444.6
JAB (err):
7037.40 (0.90) Hz
Solution:
f0:
-9487.75 Hz
D:
15338.00 Hz
JAB:
7037.40 Hz
D/JAB:
2.18
2C:
16875.40 Hz
(2C-D)/2:
768.70 Hz / 4.12 ppm
νA:
-1818.75 Hz
δA:
-9.7519 ppm
νB:
-17156.75 Hz
δB:
-91.9925 ppm
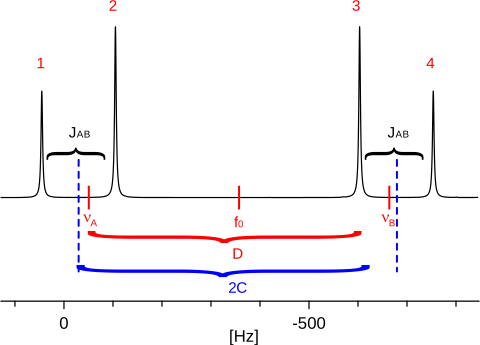
Simulation of AB
(Interested in the image? Here is information on the SVG graphics: SVG)
ν1 =
2468.65 Hz
I1 =
0.5830
plot limits:
ν2 =
-4568.75 Hz
I2 =
1.4170
high frequency:
4859.93
ν3 =
-14406.75 Hz
I3 =
1.4170
low frequency:
-23835.43
ν4 =
-21444.15 Hz
I4 =
0.5830
References
Günther, H. NMR-Spektroskopie, Eine Einführung. Georg Thieme Verlag, Stuttgart, 1973.